Building a faster FT.com
March 2016
How slow websites damage publishers revenue
++
The FT is building a new version of its website.
Conventional wisdom states that web performance matters and the emphasis of new technical standards like H2 and products for publishers like AMP and Instant Article is speed, acceleration, and instantaneousness.
But why does this matter to our business?
We wanted to understand how much the speed of our website affected user engagement, specifically, the quantity of articles read, one of our key measures of success. Using that data we then wanted to quantify the impact on our revenue. Method
We ran two tests, each about 4 weeks in duration.
In the first test subscribers were divided into two equal groups. The control group saw the standard website and the other half saw a five-second delay added to each page load.
The first test showed a significant drop in engagement from the slower group so the test was repeated and this time our users were segmented into four groups. The control group, again, saw the website at normal speed, the second group saw a one-second delay added to each page load, the third group a two-second delay, and the last group a three second delay.
The delay was achieved by inserting a blocking CSS call within each HTML page. The CSS referenced a file that was configured to (artificially) respond in one, two and three seconds, depending on the test variant. On fast connection the new FT site generally renders within 2 seconds, about 3 seconds quicker than ft.com. The delays we introduced were in addition to this baseline load time.
We were interesting in looking at the effect of a delay on three axes :-
- By device class (and by proxy, network speed) - mobile, tablet, desktop
- By users’ historical level of engagement on ft.com - high, medium, low
- Time - 7 day, 28 day windows
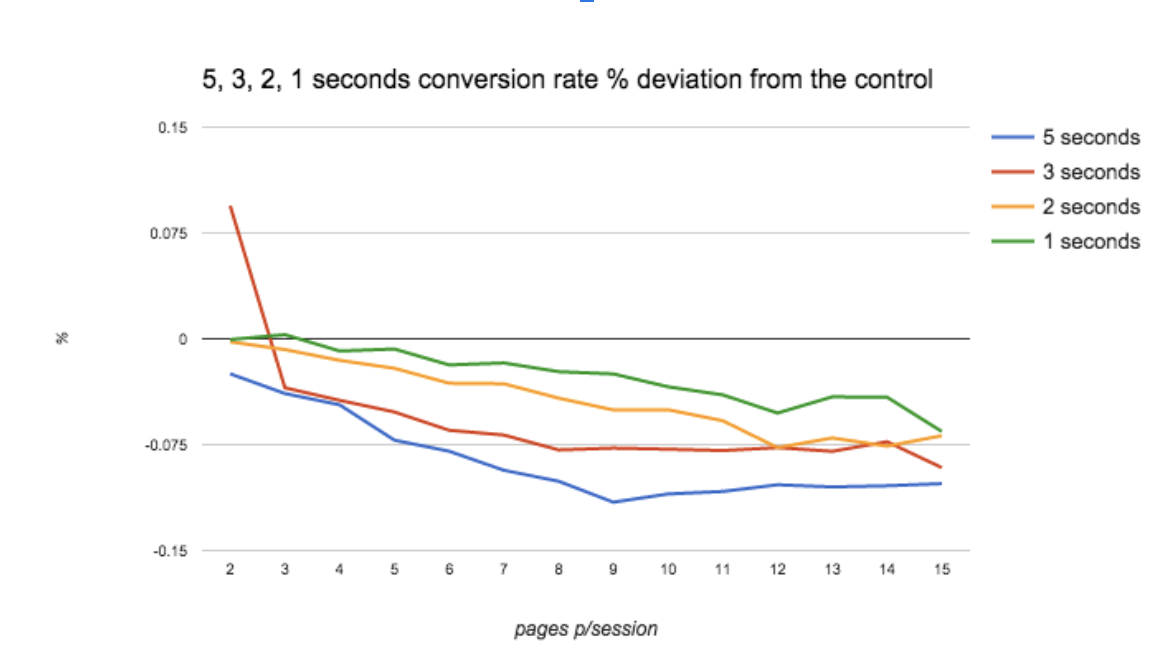
Impact on session depth
Session depth is the number of pages a user views during a visit to FT.com. We used this as our conversion rate (from users who viewed at least two pages, up to 15) and calculated the difference between users who converted in each of the test variants.
We saw little impact for very short visits of two pages, but for users visiting 3 pages or more we see a gradual decline across all the test variants - the deeper the journey the greater the drop-off in engagement.
At the slower speeds, 5 seconds and 3 seconds, we saw this trend saturate around 10 pages (11% worse for 5 seconds, and 7.5% for the three seconds variant), but at 2 seconds and 1 seconds the difference keeps growing.
This trend was apparent from the very first page view and accentuated for subsequent page views on mobile devices where network speed is usually slower. Tablet users, which typically arrive on faster networks, also produced this result, so network speed is not the only factor we must take into account.
7 day vs 28 day impact
As a publisher engagement depth metrics are a useful tool but our main interest lies in long term engagement rather than the one captured in one single visit.
We evaluated article consumption by subscribers over January. Firstly we measured articles read over the course of seven days to gauge immediate impact, and the following 28 days to see if the trend continued or the user’s reaction to the change abated over time.
Over the first seven days of a user arriving at the test and experiencing a one second delay we saw a 4.88% drop in the number of articles they read compared to the control group. The difference grew to 7.21% for the users in the three seconds delay variant.
After 28 days of being in the test the difference grew significantly for the two and three second variants, 4.42% to 5% and 7.21.% to 7.89% respectively.
In conclusion, over the testing period users read fewer articles each day whilst experiencing delays loading each web page.
| Page load time | 7 days impact | 28 days |
| 1 second slower | -4.88% | -4.57% |
| 2 second slower | -4.42% | -5% |
| 3 second slower | -7.21% | -7.89% |
High vs low engagement
Our second engagement test during the same time period surveyed the article consumption of highly engaged readers with less frequent visitors.
Our highly engaged readers show less adverse reaction to the shortest delay we placed on them than the overall sample during both the 7 and 28 day periods (Eg, 1.2% at one second over seven days, 3.6% over 28 days), though with the longer delays there was not as clear distinction.
We think highly engaged users are prepared to be patient with a slight degradation in website performance due to their need or habit around the information we publish.
Users with lower engagement rates showed an extreme reaction to even a short delay however this did not carry to 28 days.
This data point did not reach statistical significance. Low engaged users, by definition, use our website less than highly engaged people and therefore we collected less information on how performance affects their behaviour. We need to repeat the test for an extended duration to satisfy this gap in the data.
| Page Load Time | High Engagement users | Low Engagement users | ||
| 7 days | 28 days | 7 days | 28 days | |
| 1 seconds | -1.2% | -3.6% | -23.9% | -6.8% |
| 2 seconds | -4.3% | -6% | 19.6% | 31.1% |
| 3 seconds | -7.3% | -8.4% | -12.6% | 0.3% |
Devices: Mobile vs tablet vs desktop
Lastly we compared the consumption of users arriving with different types of devices.
Over the 7 day window mobile users seemed unaffected by a one and two second delay, although we see a slight drop in usage at three seconds. After 28 days mobile statistics of each variant gravitate towards the average decline in engagement we elsewhere.
Our hypothesis is that mobile users are receptive to small delays as they may blame the network connection, but as delay becomes unreasonable and consistent the engagement drops off at higher rates.
Tablet users saw a dramatic decline in engagement (18.77%), even at the introduction of a one second delay, which lessens as two and three seconds. This trend after 28 days was not statistically conclusive. Do tablet users have a lower patience threshold for lags in render speed? We’d need further research to investigate this.
Desktop also saw a decline, this falls in line with the impacts previously mentioned.
| Page Load Time | 7 days | 28 days | ||||
| Mobile | Tablet | Desktop | Mobile | Tablet | Desktop | |
| 1 seconds | 9.13% | -18.77% | -6.3% | -1.16% | -14.43% | -4.1% |
| 2 seconds | 1.1% | -10.2% | -4.1% | -5.89% | -1.4% | -2.2% |
| 3 seconds | -4.3% | -10.4% | -6.5% | -9.0% | -4% | -6.5% |
Revenue Impact
We used the data above to understand the impact on revenues.
Lower engagement impacts two revenue streams at the FT.
Firstly, we have long measured the correlation between engagement and subscription renewal rate. When our users engagement drops, so do our subscriptions.
Secondly, our advertising inventory is measured in part by page views and in part by the time each advert is seen for - the longer a user stays on our website the greater their exposure to our advertisements.
It’s clear from our test that the speed of our website affects both of these revenue streams, over the short term, to the tune of hundreds of thousands of pounds, and in the long-term millions. In summary
The speed of the site negatively impacts a user’s session depth, no matter how small the delay.
Slow sites also have a detrimental effect on the number of articles people read.
Largely, the slower the site, the greater the effect.
This trend is borne out over time, and typically worsens over time with continued delays.
The two anomalies to this general trend is that highly engaged people and mobile users, who both seem less deterred by a short-term drop in performance.
Although our starting point, the page load time for the control group, is very good, the data suggests, both in terms of user experience and financial impact that there are clear and highly valued benefits in making the site even faster.
From this research we’ve chosen to invest even more time in making every aspect of the new FT.com website even faster over the coming months.