LTN21 boundary traffic: Pt 2
July 2021
Follow-up notes on traffic around low-traffic neighbourhood LTN21 in West Ealing.
++
During October and November last year I collected approximate 50k journey time estimates around the Ealing area from a well known sat nav company in order to provide some analysis of the situation.
In summary I found the roads are busy, as one might expect from a thoroughfare in a large city, but traffic flows freely for most of the day. At the two peak times either side of the day the traffic volume increases and so does the average journey time by a few minutes but arguably this is entirely in line with expectations and historical norms - commuters, school traffic, public transport, taxis, delivery vans and an increase in pedestrian footfall all compete for the same stretch of road at the same time.
I also noted that the bulk of congestion occurs outside of standard school hours, which should offer some assurance to those worried about pollution caused by idling cars adjacent to playgrounds, although any traffic is still clearly problematic in this regard.
My full write up is published here, including charts and videos to explain the data.
It's worth repeating that I do understand there's many different perspectives on low-traffic neighbourhoods and what I write here is an attempt at some objective analysis and not an attempt to invalidate anyones individual experience, good or bad.
++
Unfortunately, since I wrote about this, the Council removed several of the traffic filters. Although I was upset at it's removal, one benefit of the decision to suspend LTN21 was that I can now repeat the analysis and compare the traffic patterns with and without the LTN in place. So over the past month I've collected the data for the same routes as I did back in October.
For context the data I've compared is the full week, Monday through to Sunday. The 2020 data includes a week of lockdown 2 at the end whereas the 2021 data was collected during Stage 2/3 of lockdown easing. From reading around the subject I don't think either period had a significant impact on private vehicle usage in London. Both data sets contain 5 days of half-term where traffic was a little reduced around the school start and end. Roadworks and traffic incidents were also included in both sets of data, which do have some impact on journey times but average out across the year. Lastly, the changes in access to Swyncombe Avenue have made this stretch of road incomparable.
Average journey time around LTN21
The first comparison I made was the average journey times around the four boundary roads with and without LTN21 in place.
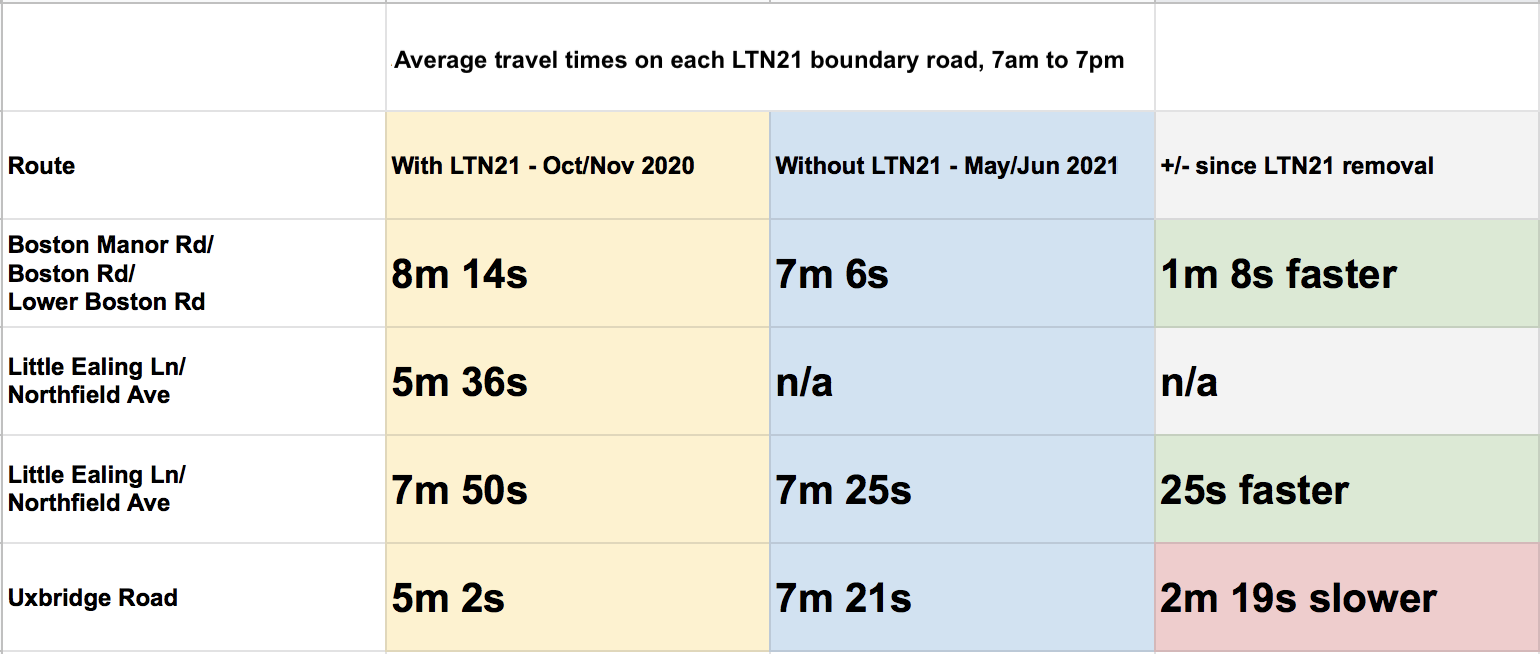
You can see that compared to October journey times around the Western and Eastern LTN21 boundaries have become a little faster and along Uxbridge Rd a little slower on average.
It's worth noting that taking into account all three boundary roads there's a net increase in journey times around LTN21 since it's removal.
The standard deviation for the data is relatively close to the mean, 1-2 minutes in most cases, which assures me that the average is a good measure of typical journey time one might experience around these roads.
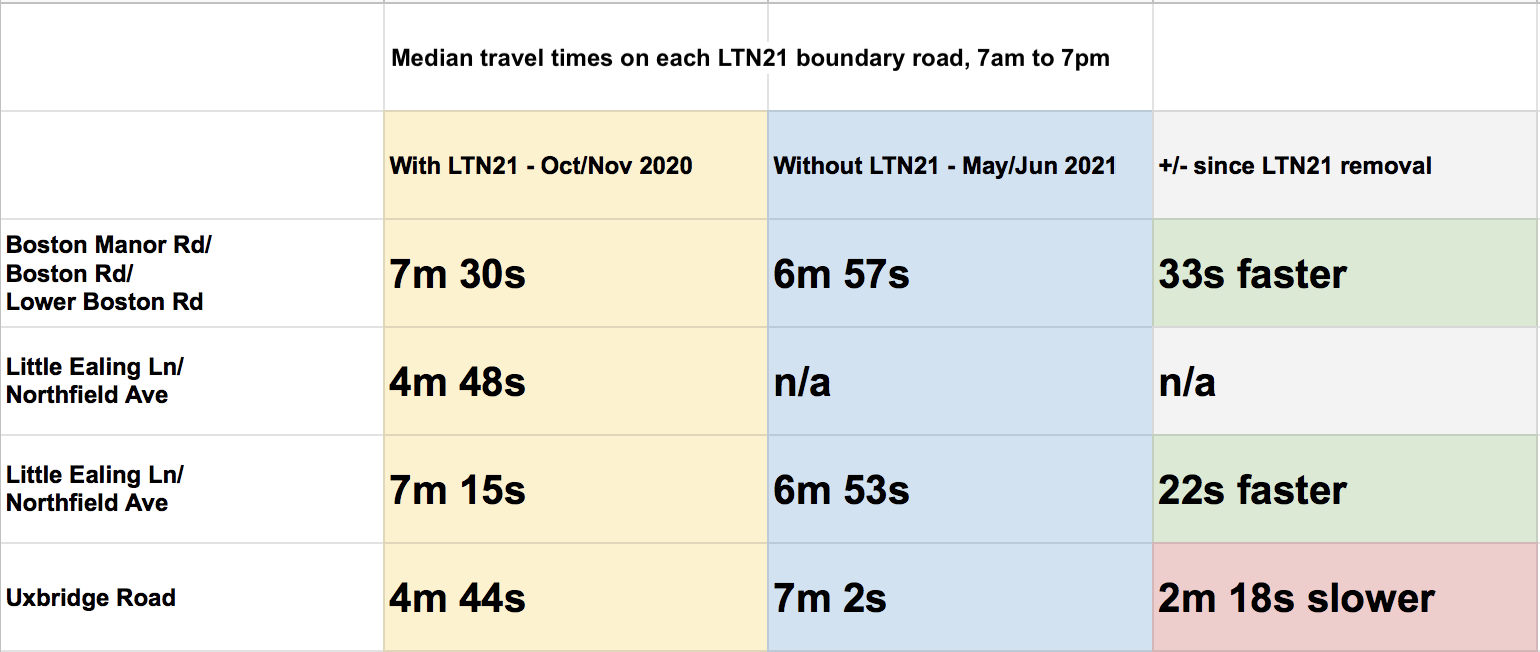
The median data shows a similar story, which again points to the normal driving experience being somewhere around the mean or even a little faster.
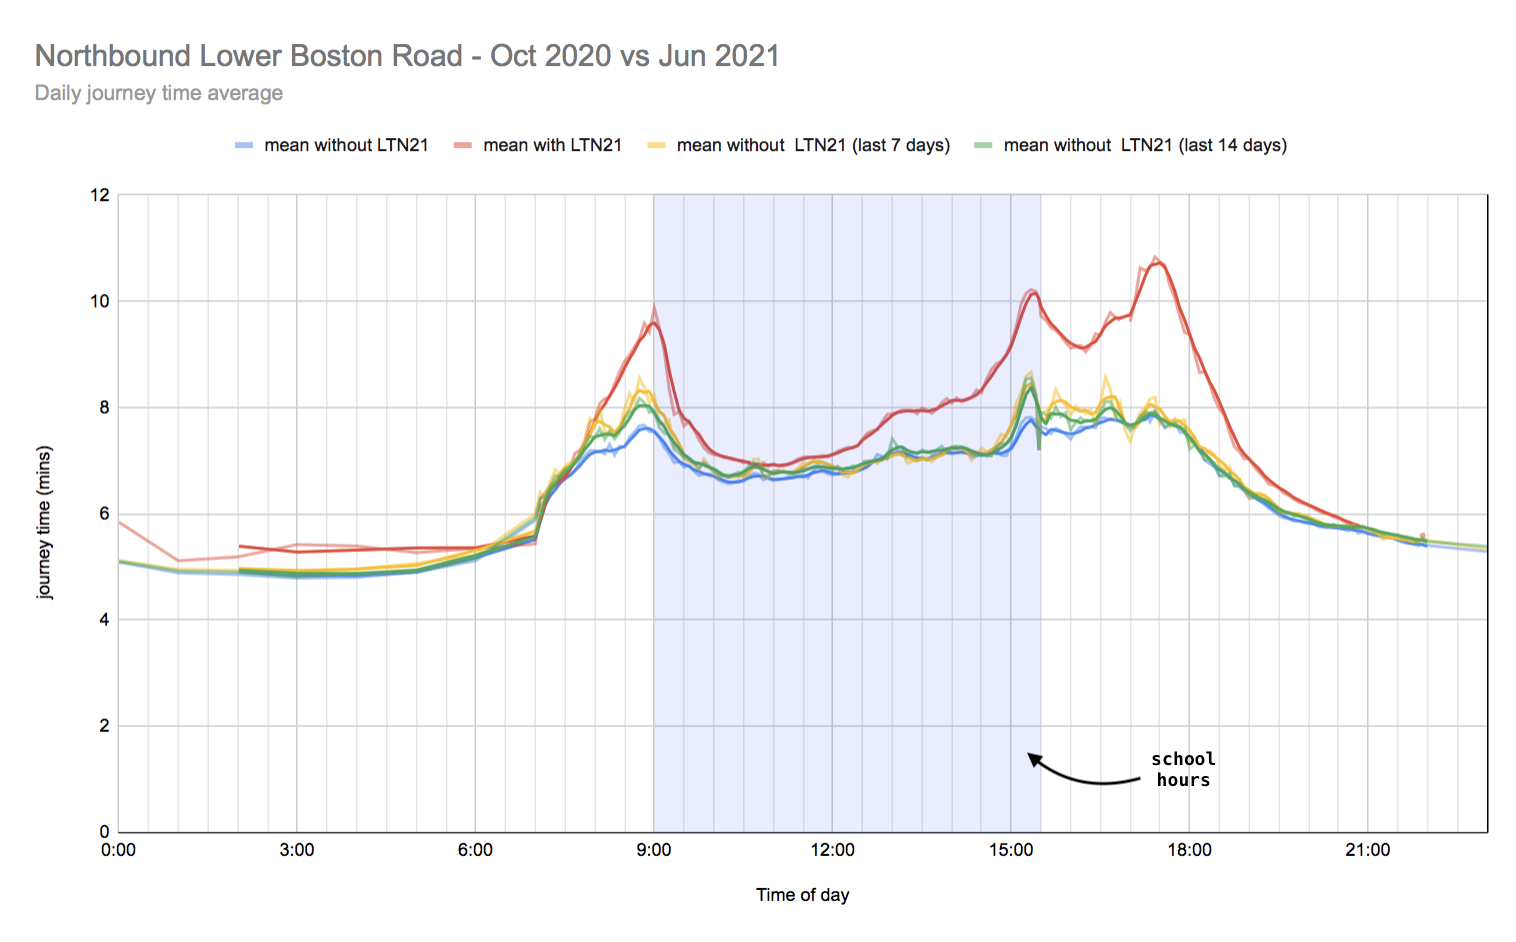
Journey times
The other comparison I made is the journey times throughout the day with and without LTN21 in place.
In the case of Boston Manor Rd the graph below shows the average journey time has been reduced by a minute or two at peak time, presumably by designated main road traffic navigating through our residential areas. As a resident in the middle of LTN21 working from home I can certainly attest to the noticeable increase of cars down my road in the past few weeks.
However, before we jump to this conclusion, none of the other data shows a similar reduction. For example, Northfields Avenue on the Eastern boundary shows largely the same journey times this last month as it saw in October 2020 and, as discussed above, the Northern LTN21 boundary shows it is worse today than observed 8 months ago.

++
Based on the above it does feel the war waged on LTNs as the sole cause of widespread traffic chaos and the many arguments made off the back of that - pollution, discrimination etc. - are unfair. Removing an entire LTN with a perimeter of 6.1km has led to a small reduction in journey times in places and no change or increases in other surrounding roads whilst removing the benefits of quieter and safer residential streets.
The Council's own research shows a similar situation,
The available data clearly shows that traffic volumes and congestion on the majority of LTN boundary roads have not significantly increased and follow a similar pattern to other local B-roads, and therefore are not of concern. The exception to this is the westbound approach along Pope’s Lane to the South Ealing Road signals, although gasworks are believed to have contributed to the increase, and Lower Boston Road.
The quandary is this: should the experience on a short 150m stretch of road where the low-traffic neighbourhood trials have apparently increased the journey times dictate the Active Travel policy of entire Borough of 344k people?
While data is not the sole basis for Council policy decisions in my view better data does make future such decisions higher in quality, so I hope this note is useful in that regard.
++
If you live in Ealing please do spend 2 minutes giving the Council feedback on the current LTN trials.